
Clarify for Shipping
Act on facts, faster than before

Fouling detected
LNG Carrier · North Sea Lane 2
03:14
Fuel consumption above baseline
Tanker Nordic Star · Engine 1
03:14
Root cause analysis generated
Offshore Terminal · Berth 3
03:14
Partners & Customers
Trusted by innovators in shipping


The Problem
Running a fleet means small problems every day
We know how hard it is. Here are the four we hear most, and every one shows up in your data first.
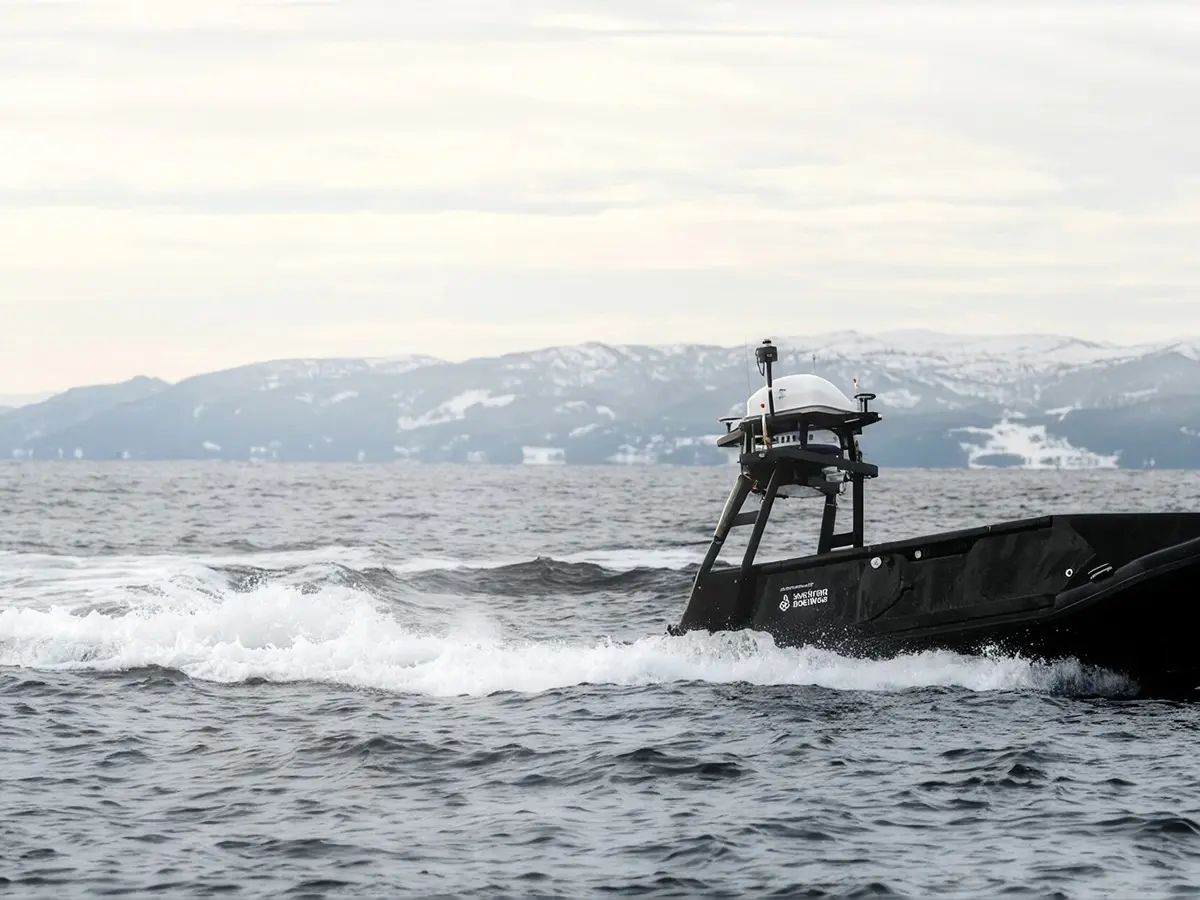
Engines fail, fuel burn climbs, and you don’t know why
The automation system, the noon report, the maintenance log. Each holds part of the answer.None of them talk, and your charter pays for it.
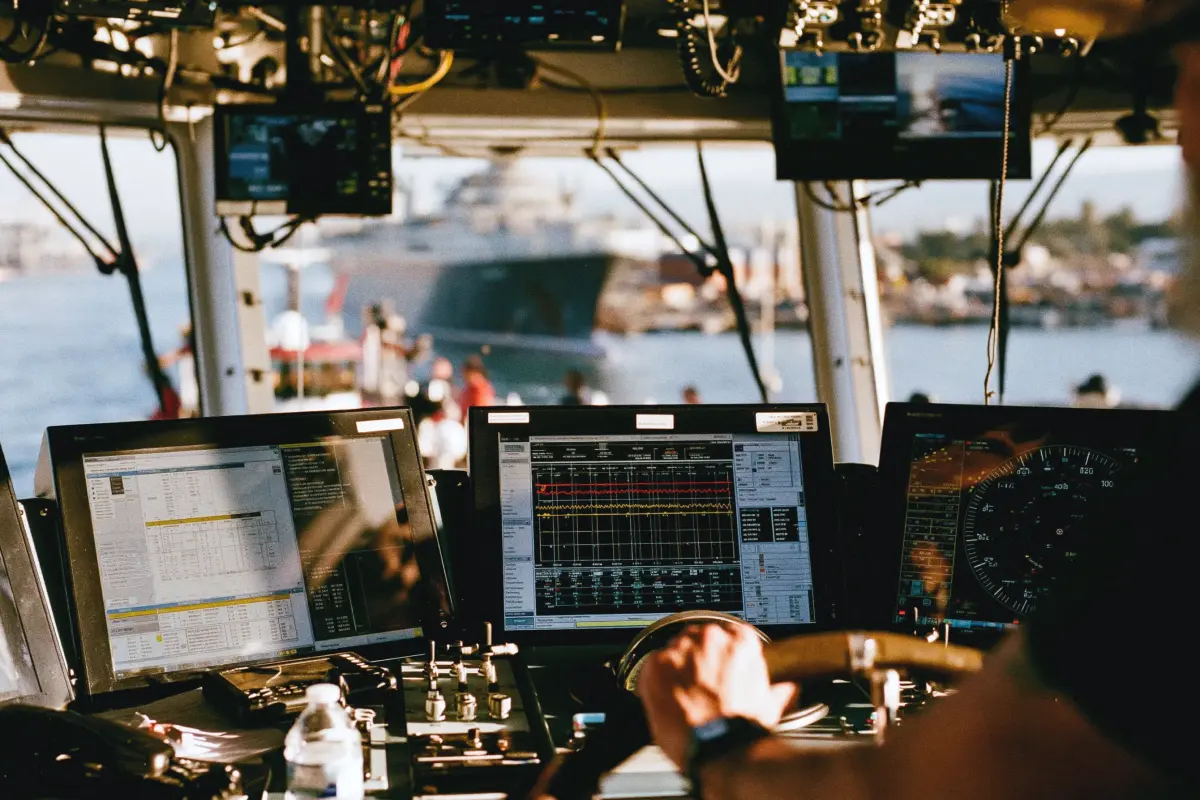
Unreliable data keeps your crew frustrated and overwhelmed
A fuel spike reads like a fault until you know the crew switched fuel entering an ECA. Contextlives in heads and paper logs.
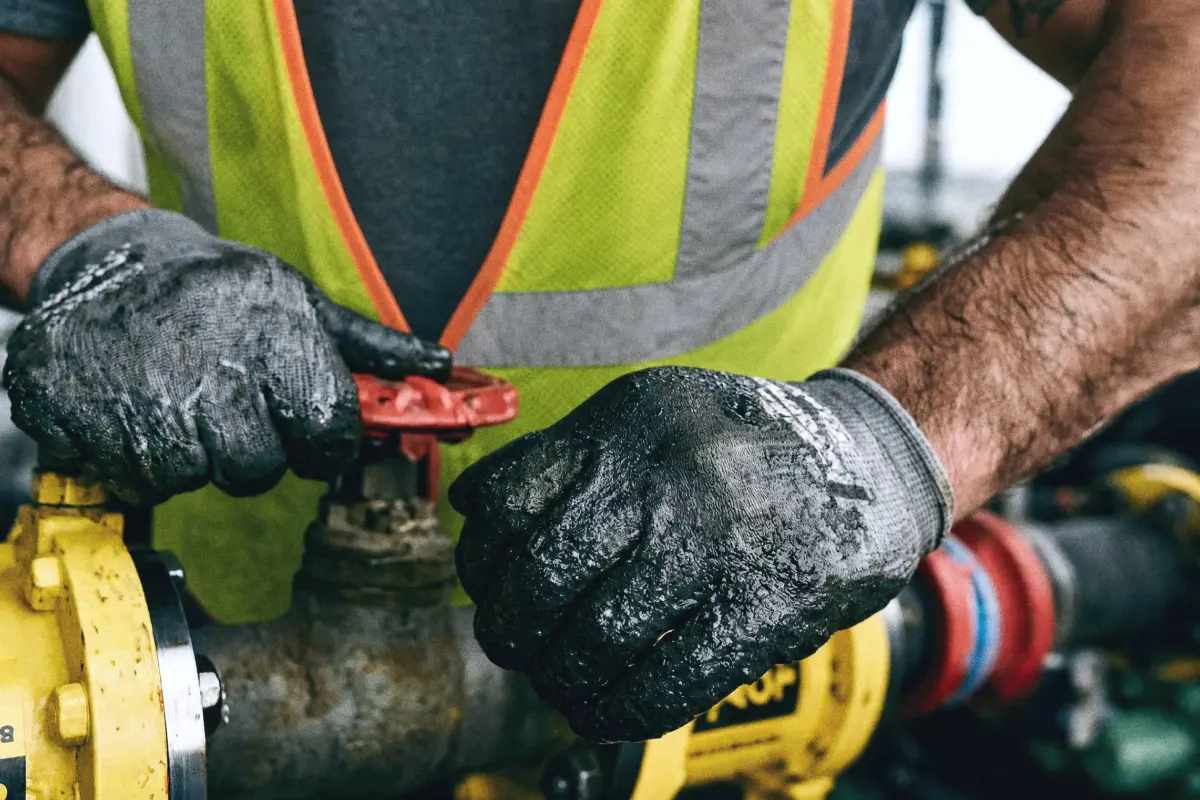
Problems surface after they cost you
Hull fouling, seized pumps, and engine drift show up at inspection or in the monthly report. By then the damage is done.
BUILT TO EXTEND
Know early, ask why.
build on the same data
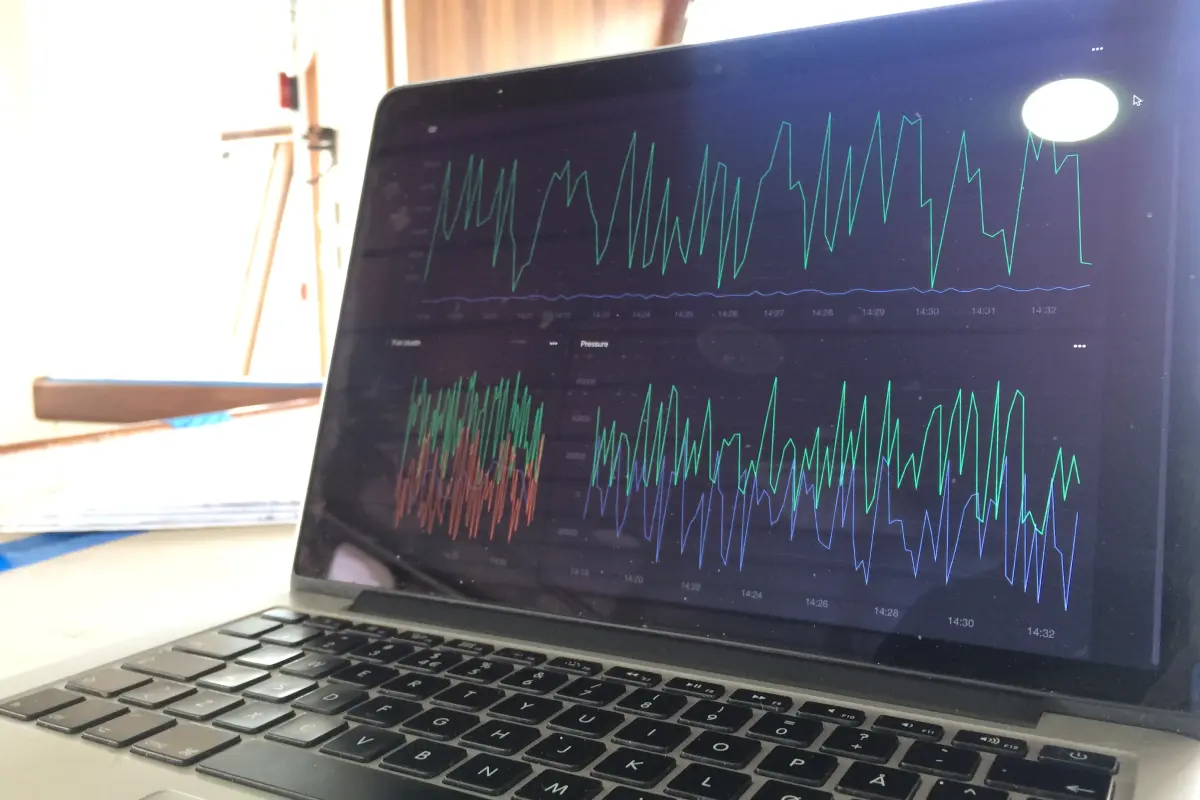
Most platforms end at their own screen. Clarify sends your data onward, to your phone, to the tools you already use, and to whatever your team builds next.

Get notified where you work
Set the conditions that matter. Clarify tells you when they're met, on whatever device you're on.

Ask in plain language
Your data arrives with context attached, so any model or agent your team uses can answer questions about it
Power any AI and agent
Dashboards, work orders, internal tools, build them on Clarify with the tools your team already uses.
What Clarify does
Built for the way shipping actually runs
Live streams. Human context. Autonomous agents. All of your domains, in one place your organisation owns.
Same operation. New outcomes
Your team can act on facts and focus on work that matters. Clarify handles everything between the signal and the action.
Every vessel, sensor, and system in one live view
Fuel flow, engine load, running hours, alarms, every stream from every vessel flowing into one place your shore team can actually query. No more chasing readings across twelve onboard systems.

Add the context the sensor can't see
The sensor doesn't know the number two auxiliary was down for maintenance. Your crew does. Add a fuel switch, a delay, a repair, right on the reading itself, from the app or the desk.
Build it once, runs on its own
One vessel, pumps and valves in the thousands. Build one agent, it watches fuel flow, engine load, and shaft speed together, and fires the moment burn drifts out of line for the speed you are making. Runs 24/7.
Deliver events wherever action lives.
Get the alerts on mobile, web, Slack, work-orders, your own dashboards, or the tool your team hasn't built yet.
Prevent downtime
Track vessel health
Monitor engine load
Spot fouling early
Predictive maintenance
Performance optimisation
Automate noon reports
High frequency data for agents
Route optimisation
Innovate on vessel and systems
Fleet optimisation
Prevent claims
Cut time to detect
Operationalise new technology
Cut fuel costs
Cut time to repair
Prevent downtime
Track vessel health
Monitor engine load
Spot fouling early
Predictive maintenance
Performance optimisation
Automate noon reports
High frequency data for agents
Route optimisation
Innovate on vessel and systems
Fleet optimisation
Prevent claims
Cut time to detect
Operationalise new technology
Cut fuel costs
Cut time to repair
Prevent downtime
Track vessel health
Monitor engine load
Spot fouling early
Predictive maintenance
Performance optimisation
Automate noon reports
High frequency data for agents
Route optimisation
Innovate on vessel and systems
Fleet optimisation
Prevent claims
Cut time to detect
Operationalise new technology
Cut fuel costs
Cut time to repair
Results
Customer stories
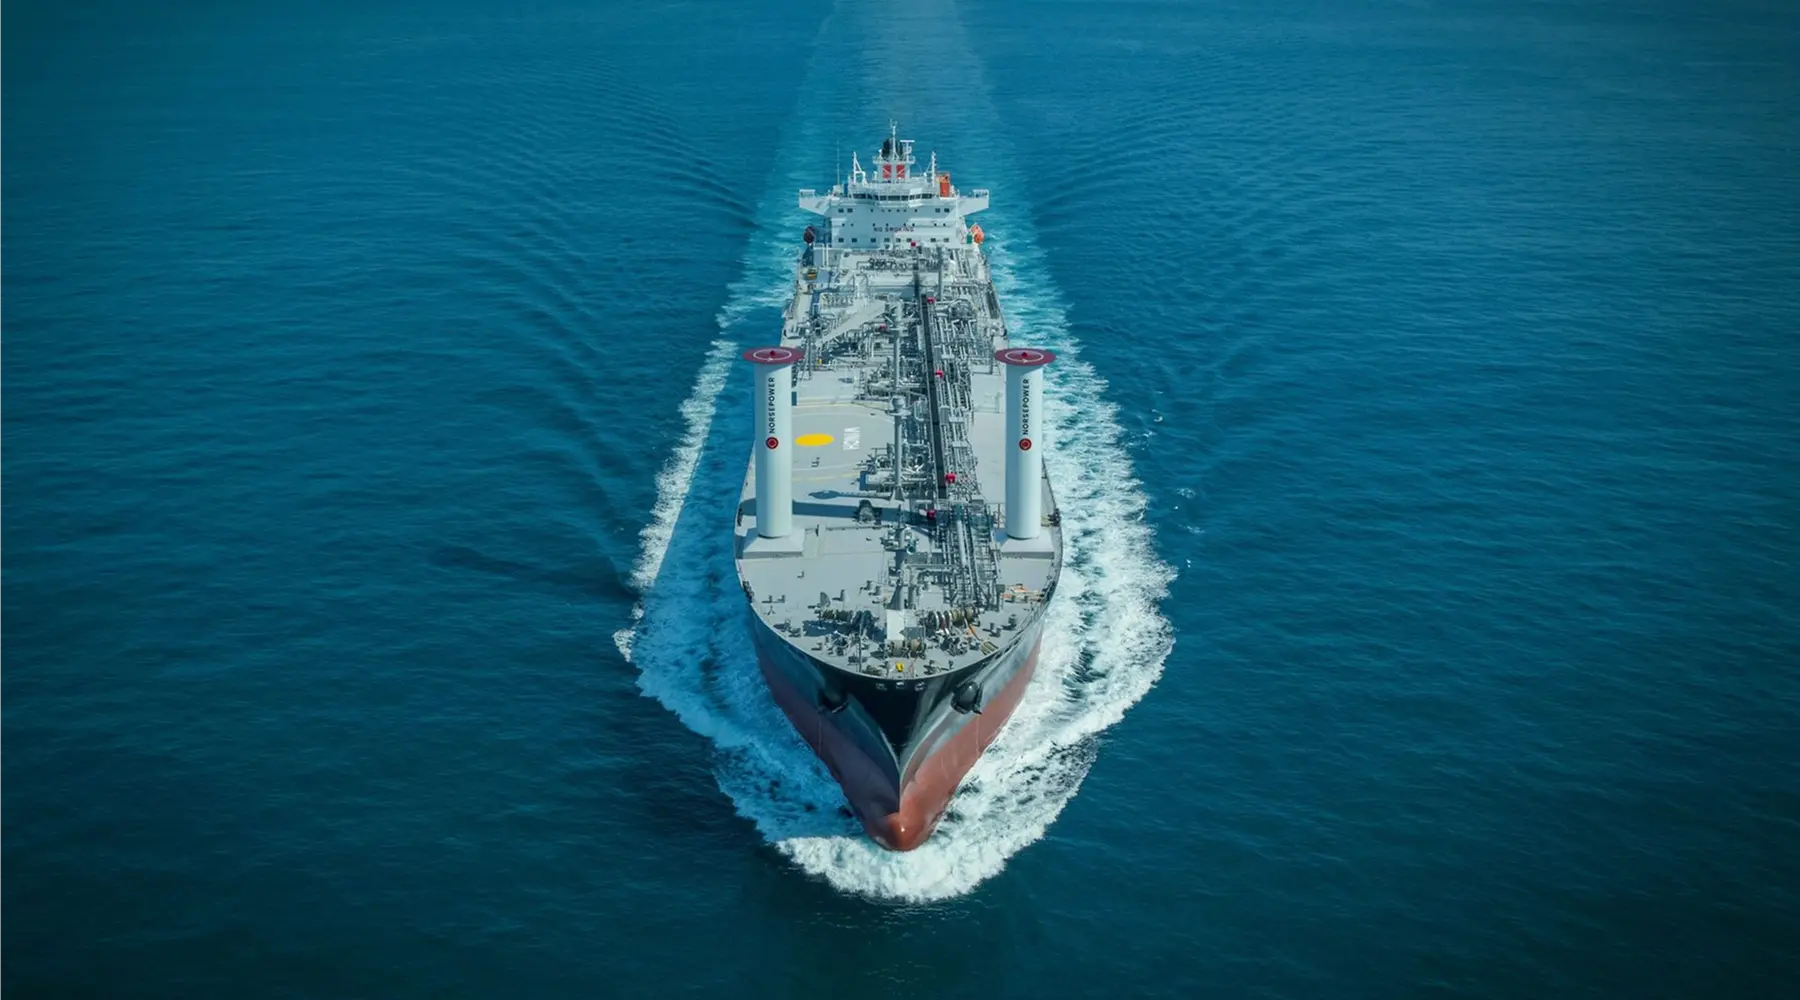
IINO Lines documents the fuel and CO₂ savings from its rotor sails
%201.webp)
FORWARD DEPLOYED ENGINEERING
Our engineers land beside your chief engineers
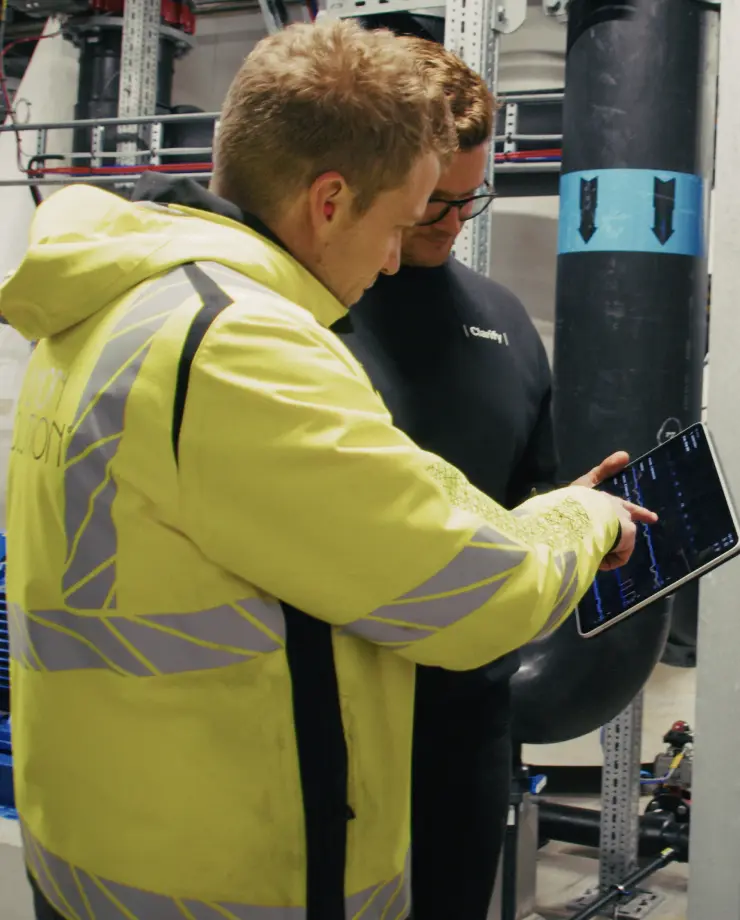
Start with our engineers by your side. We connect your systems, your data, and your AI, and we stay until the result shows.
Control
Your operation, made legible
From manual burden to automated advantage. Our engineers land on your site to map out your systems and make data flow, connecting the realities of your operation with the power of AI.
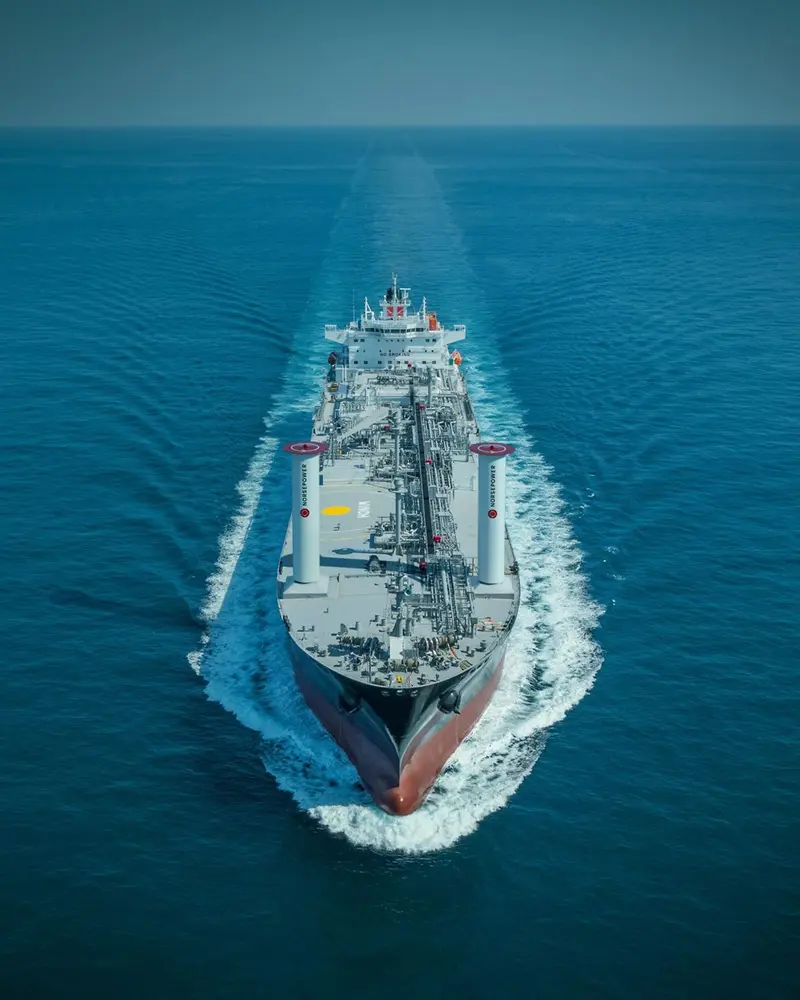
IINO Lines uses Clarify to measure, validate and improve the performance of its rotor sails.
Solve problems
Together we solve your hardest problems
Sitting beside your team, our engineers turn what your experts already know into events that fire on their own. Measurable impact starts here, and your team learns to build without us.
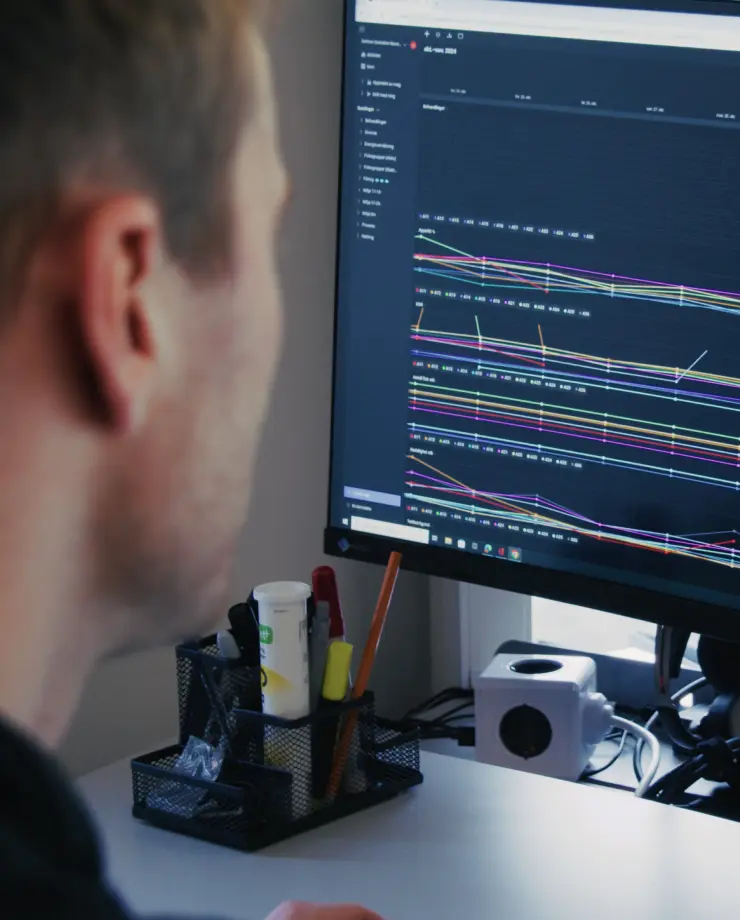

Clarify
Combining building automation data with low-cost IoT sensors in Clarify cut our office energy costs by 30%.
Grow
Make data your competitive advantage
Your team builds new events, solves problems, and innovates with data. Our engineers step back, still on call as your trusted partner. Operations runs on you.
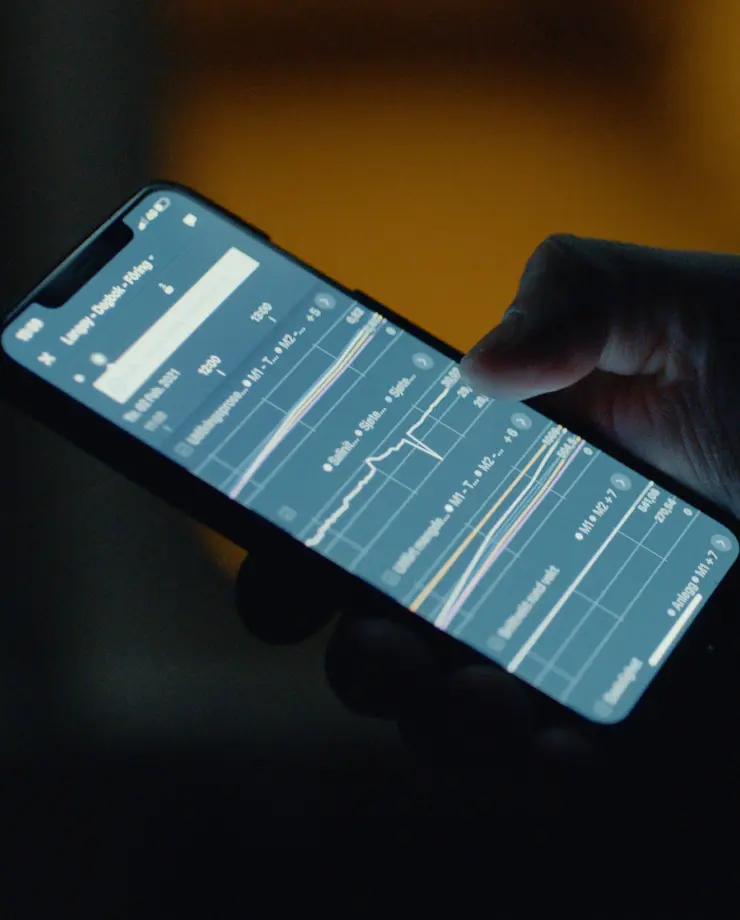
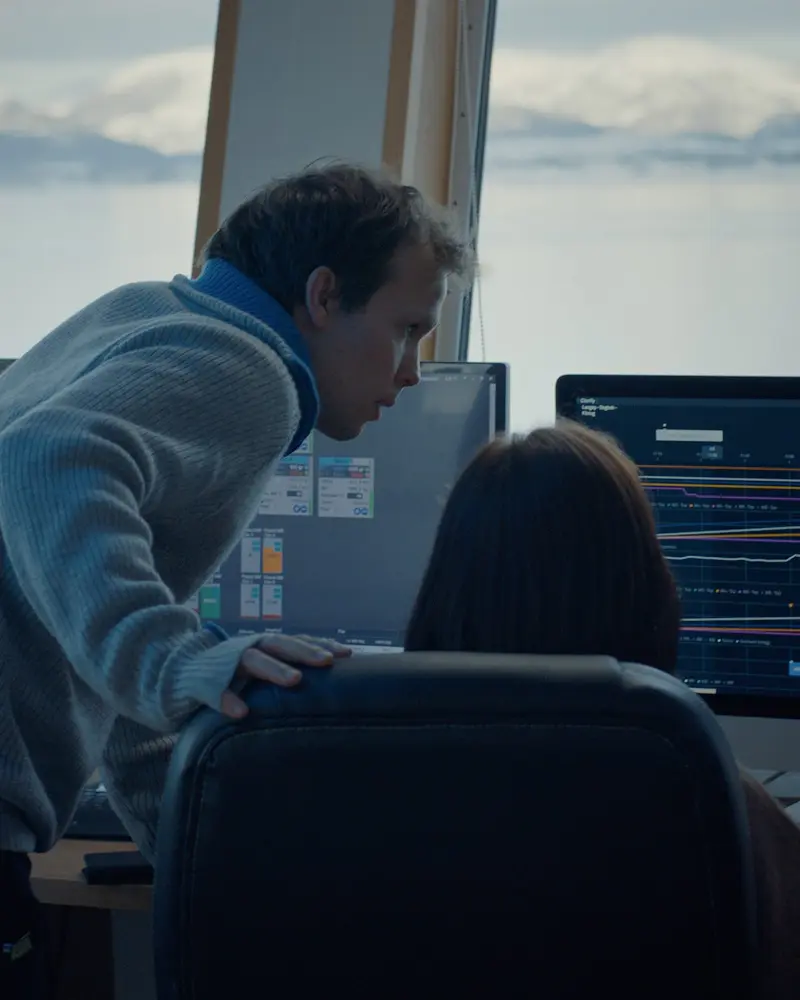
Neuron and Clarify form a production-ready stack from integration to visualization and collaboration.
Start today
See what Clarify catches on your fleet
Bring one vessel and one problem. We connect the data and show you what your fleet already knows.