
Daily growth report generated
North Sea Farm · Pen 04
03:14
Feed intake below expected
Hardanger Site · Pen 06
03:14
Stress event detected
North Sea Farm · Pen 04
03:14
Daily activity report generated
Gate 2 · East fence line
03:14
Increased RF activity detected
Relay 04 · Ridge Station
03:14
Turbine vibration above limit
North Ridge Wind Park · T-07
03:14
Yaw gear #4 under high load
Coastal Array · Turbine 12
03:14
Root cause analysis generated
Substation B · Feeder 3
03:14
Fouling detected
LNG Carrier · North Sea Lane 2
03:14
Fuel consumption above baseline
Tanker Nordic Star · Engine 1
03:14
Root cause analysis generated
Offshore Terminal · Berth 3
03:14
Turn operational data into measurable impact
Partners
Trusted by innovators in food, defence, energy and shipping


What Clarify does
Add AI to any asset
Clarify models the parts of every operational call, signals, reasoning, and actions. Every layer and decision is addressable and traceable.
BUILT TO EXTEND
Power anything with better data
Most platforms end at their own screen. Clarify sends your data onward, to your phone, to the tools you already use, and to whatever your team builds next.

Get notified where you work
Set the conditions that matter. Clarify tells you when they're met, on whatever device you're on.

Ask in plain language
Your data arrives with context attached, so any model or agent your team uses can answer questions about it
Power any AI and agent
Dashboards, work orders, internal tools, build them on Clarify with the tools your team already uses.
Results
Customer stories
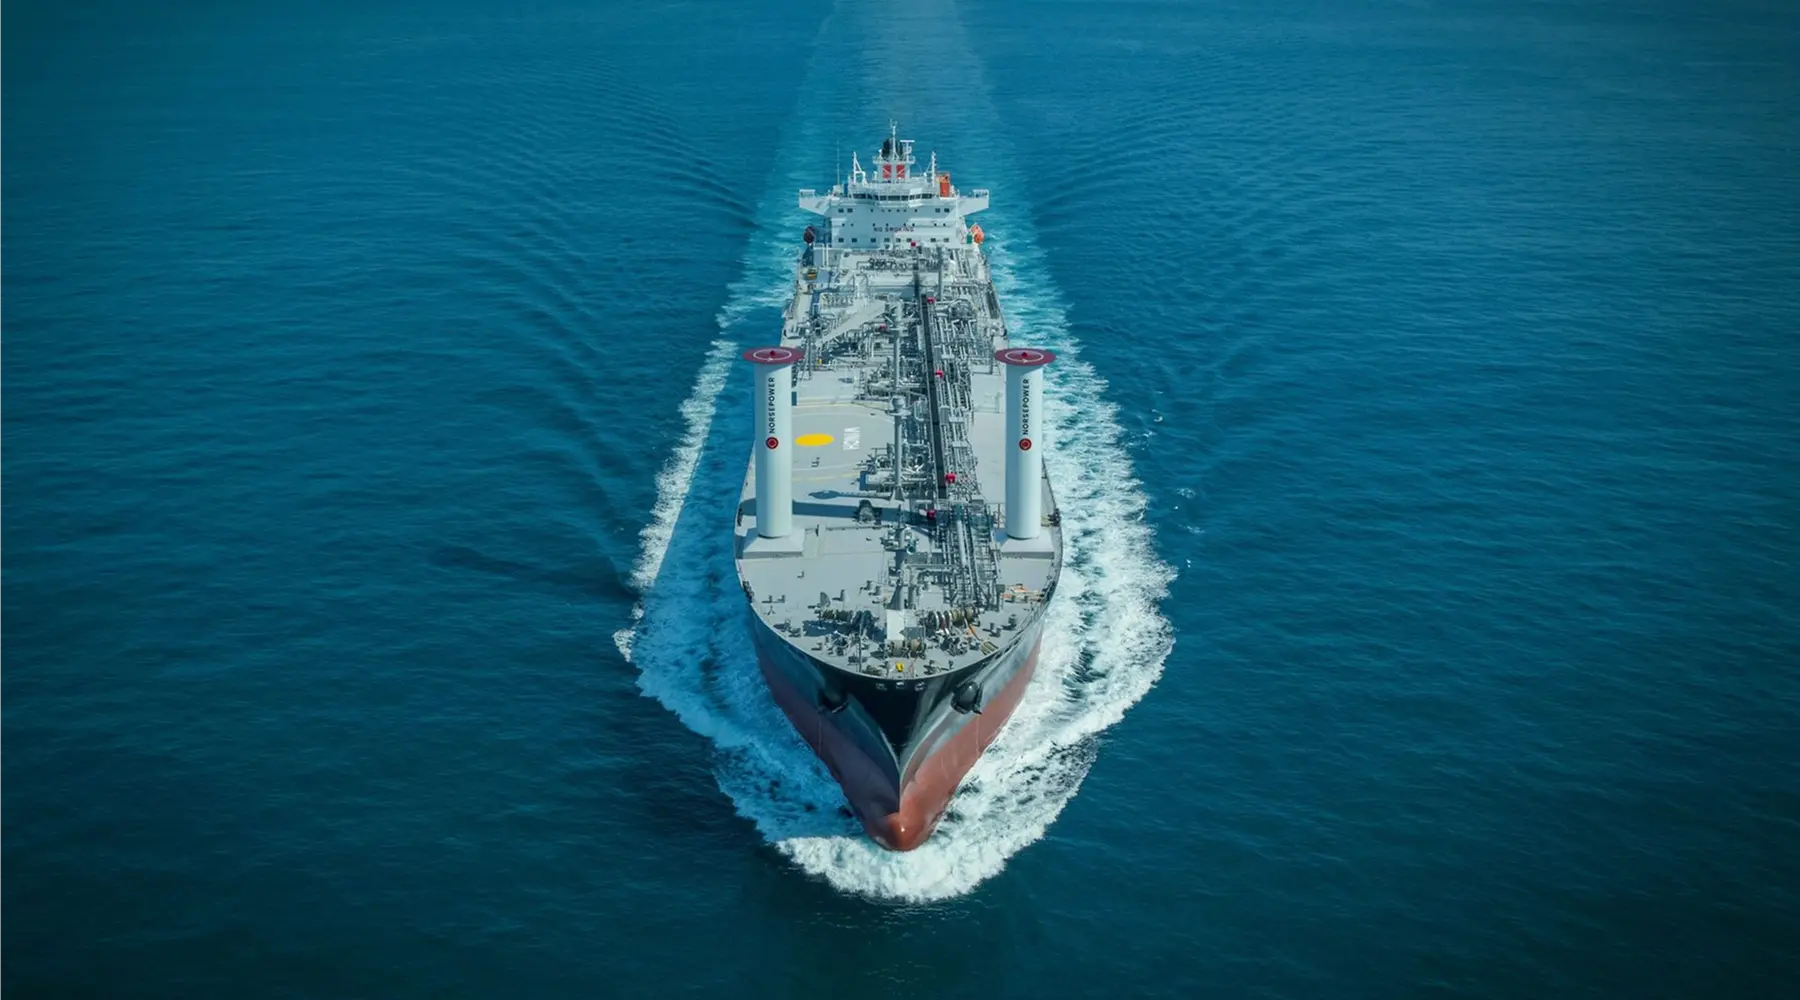
IINO Lines documents the fuel and CO₂ savings from its rotor sails
%201.webp)
BUILT TO EXTEND
Built to be built on. Yours to extend
10.000.000
Ten million ways to fail. One place to see them coming.
Connect what you run. Build what you need. Route it where it matters. Clarify solves scaling, so you can focus on building your competitive advantage
Own and control your operational data. Connect, contextualise, and store any operational data source from factories, assets, SCADA, drones, and sensors.
Make OT data AI-ready. Your team adds expertise to your unique data. Clarify does the heavy lifting of transforming and enriching streams
Power any AI and agent. Models and agents only work on data they can trust. Clarify gives them structured, contextual signals over the API or MCP.
Deliver events wherever action lives. Mobile, web, Slack, work-orders, your own dashboards, or the tool your team hasn't built yet.
Warn low oxygen
Prevent feed spill
Detect stress events
Cut salmon mortality
Cut fuel cost
Prevent downtime
Track vessel health
Monitor engine load
Predict failures
Spot deviations
Pattern of life analysis
Improved situational awareness
Automation of workflows
Track asset health
Alarm equipment malfunctions
Monitor water quality
Catch outliers
Predict disease
Control equipment health
Identify irregularities
Integrate civilian systems
Filter to prevent alarm fatigue
Build baseline for any asset
Data-driven root cause analysis
Increased asset uptime
Data-driven asset maintenance
Agentic alerting
Dynamic SOP generation
Predict activity
Feed frontline data to ops
Combine data from any sensor
Automate ISR workflows
Connect C2 systems with any HW
Transform raw data into events
Data flows from field to cmndr
Automate data enrichment
Stay ahead of threats
Spot fouling early
Predictive maintenance
Performance optimisation
Automate noon reports
High frequency data for agents
Route optimisation
Innovate on vessel and systems
Fleet optimisation
Prevent claims
Cut time to detect
Multi domain data advantage
Build baseline for any area
Anomaly detection
Operationalise new technology
Cut fuel costs
Cut time to repair
Perform predictive maintenance
Optimise energy production
Perform root cause analysis
Learn asset baseline
Detect anomalies
Automate workflows
Automate reporting
Troubleshoot faster with OT-data
Automate alerts
Chat with your systems/assets
Build asset baselines
Automate invoicing on OT-data
Chat with your asset
Warn low oxygen
Prevent feed spill
Detect stress events
Cut salmon mortality
Cut fuel cost
Prevent downtime
Track vessel health
Monitor engine load
Predict failures
Spot deviations
Pattern of life analysis
Improved situational awareness
Automation of workflows
Track asset health
Alarm equipment malfunctions
Monitor water quality
Catch outliers
Predict disease
Control equipment health
Identify irregularities
Integrate civilian systems
Filter to prevent alarm fatigue
Build baseline for any asset
Data-driven root cause analysis
Increased asset uptime
Data-driven asset maintenance
Agentic alerting
Dynamic SOP generation
Predict activity
Feed frontline data to ops
Combine data from any sensor
Automate ISR workflows
Connect C2 systems with any HW
Transform raw data into events
Data flows from field to cmndr
Automate data enrichment
Stay ahead of threats
Spot fouling early
Predictive maintenance
Performance optimisation
Automate noon reports
High frequency data for agents
Route optimisation
Innovate on vessel and systems
Fleet optimisation
Prevent claims
Cut time to detect
Multi domain data advantage
Build baseline for any area
Anomaly detection
Operationalise new technology
Cut fuel costs
Cut time to repair
Perform predictive maintenance
Optimise energy production
Perform root cause analysis
Learn asset baseline
Detect anomalies
Automate workflows
Automate reporting
Troubleshoot faster with OT-data
Automate alerts
Chat with your systems/assets
Build asset baselines
Automate invoicing on OT-data
Chat with your asset
Warn low oxygen
Prevent feed spill
Detect stress events
Cut salmon mortality
Cut fuel cost
Prevent downtime
Track vessel health
Monitor engine load
Predict failures
Spot deviations
Pattern of life analysis
Improved situational awareness
Automation of workflows
Track asset health
Alarm equipment malfunctions
Monitor water quality
Catch outliers
Predict disease
Control equipment health
Identify irregularities
Integrate civilian systems
Filter to prevent alarm fatigue
Build baseline for any asset
Data-driven root cause analysis
Increased asset uptime
Data-driven asset maintenance
Agentic alerting
Dynamic SOP generation
Predict activity
Feed frontline data to ops
Combine data from any sensor
Automate ISR workflows
Connect C2 systems with any HW
Transform raw data into events
Data flows from field to cmndr
Automate data enrichment
Stay ahead of threats
Spot fouling early
Predictive maintenance
Performance optimisation
Automate noon reports
High frequency data for agents
Route optimisation
Innovate on vessel and systems
Fleet optimisation
Prevent claims
Cut time to detect
Multi domain data advantage
Build baseline for any area
Anomaly detection
Operationalise new technology
Cut fuel costs
Cut time to repair
Perform predictive maintenance
Optimise energy production
Perform root cause analysis
Learn asset baseline
Detect anomalies
Automate workflows
Automate reporting
Troubleshoot faster with OT-data
Automate alerts
Chat with your systems/assets
Build asset baselines
Automate invoicing on OT-data
Chat with your asset
industries
Click your industry to learn more
You have a lot of small problems. Clarify helps you solve them.



FORWARD DEPLOYED ENGINEERING
Get results faster with
Clarify engineers on your team
Start with our engineers by your side. We connect your systems, your data, and your AI, and we stay until the result shows.
Control
Your operation, made legible
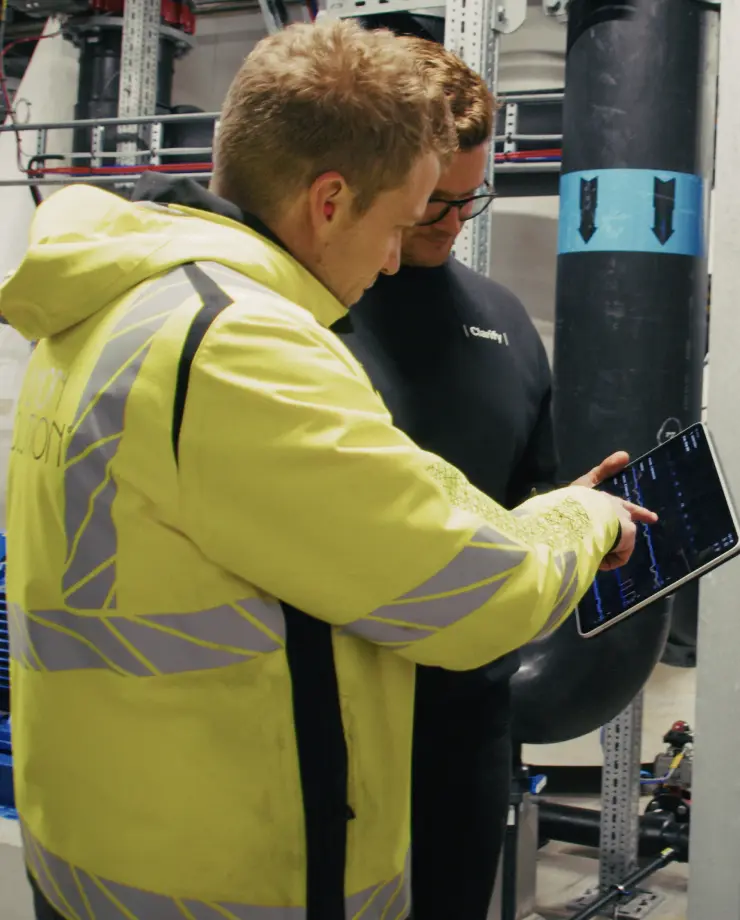
From manual burden to automated advantage. Our engineers land on your site to map out your systems and make data flow, connecting the realities of your operation with the power of AI.
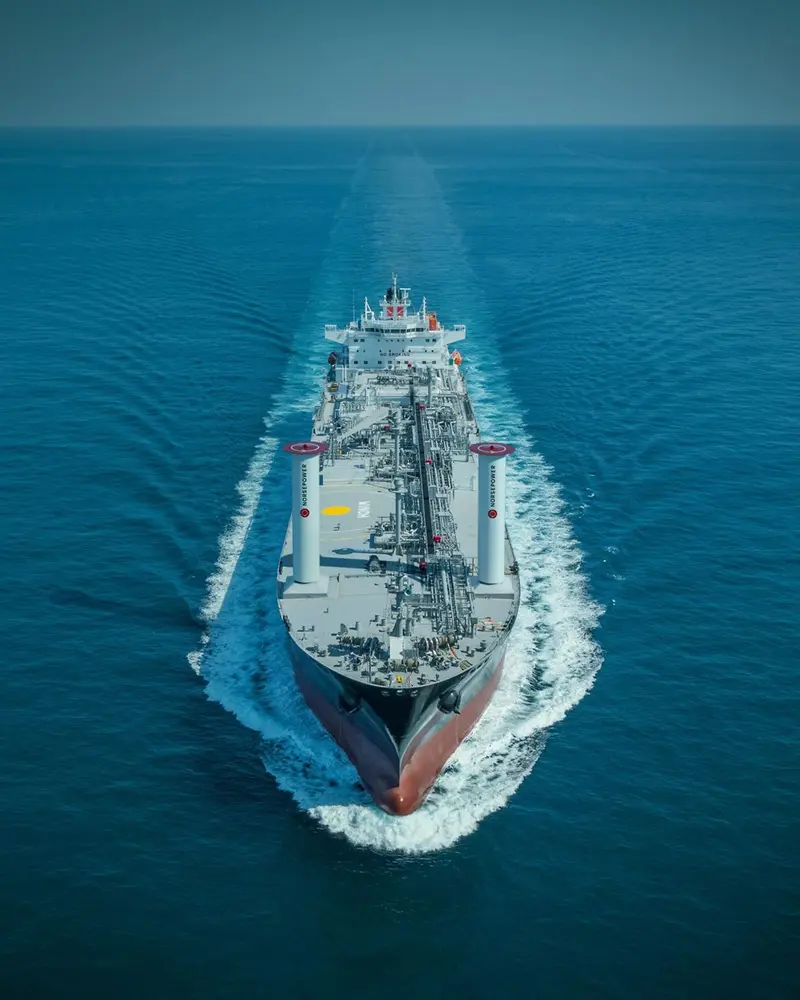
IINO Lines uses Clarify to measure, validate and improve the performance of its rotor sails.
Solve problems
Together we solve your hardest problems
Sitting beside your team, our engineers turn what your experts already know into events that fire on their own. Measurable impact starts here, and your team learns to build without us.

Clarify
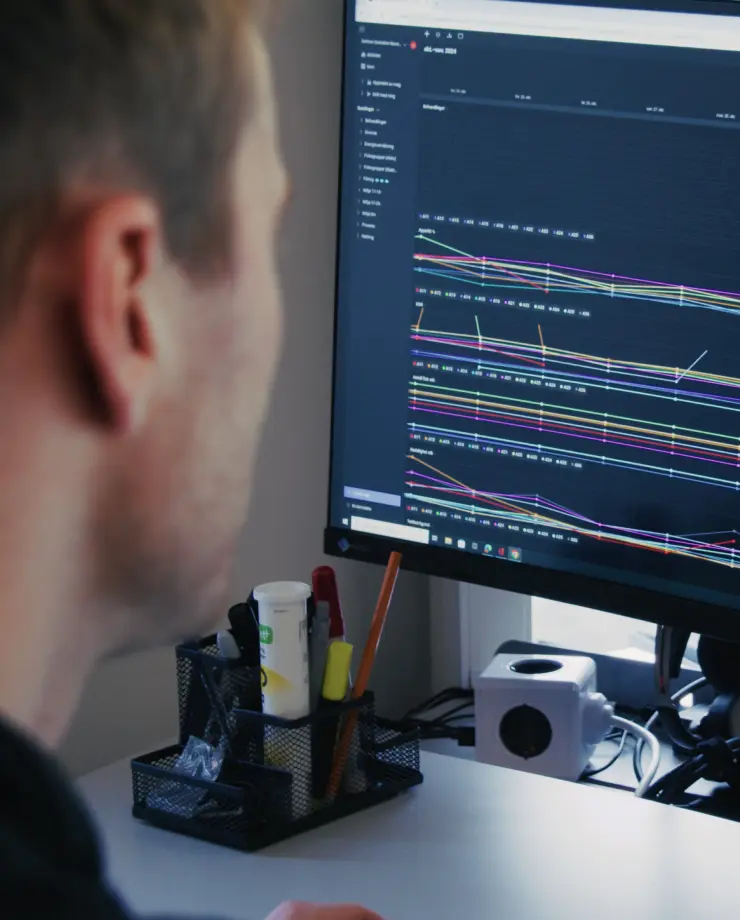
Combining building automation data with low-cost IoT sensors in Clarify cut our office energy costs by 30%.
Grow
Make data your competitive advantage
Your team builds new events, solves problems, and innovates with data. Our engineers step back, still on call as your trusted partner. Operations runs on you.
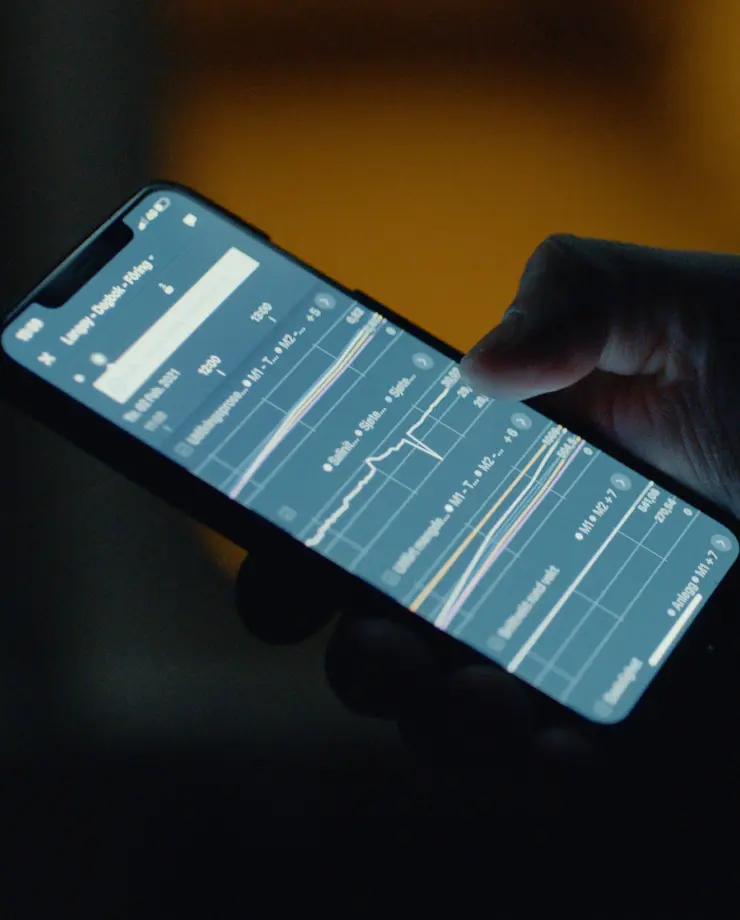
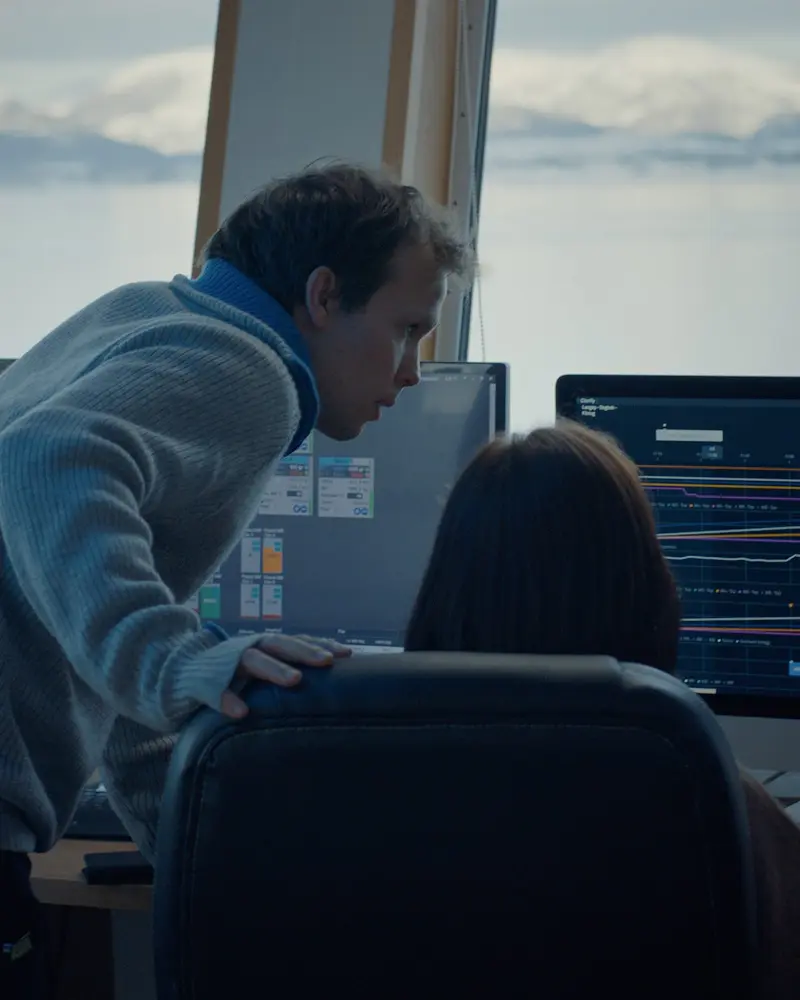
Neuron and Clarify form a production-ready stack from integration to visualization and collaboration.
Start today
See what's possible
Bring one site and one problem. We connect the data behind it and show you the fix in action